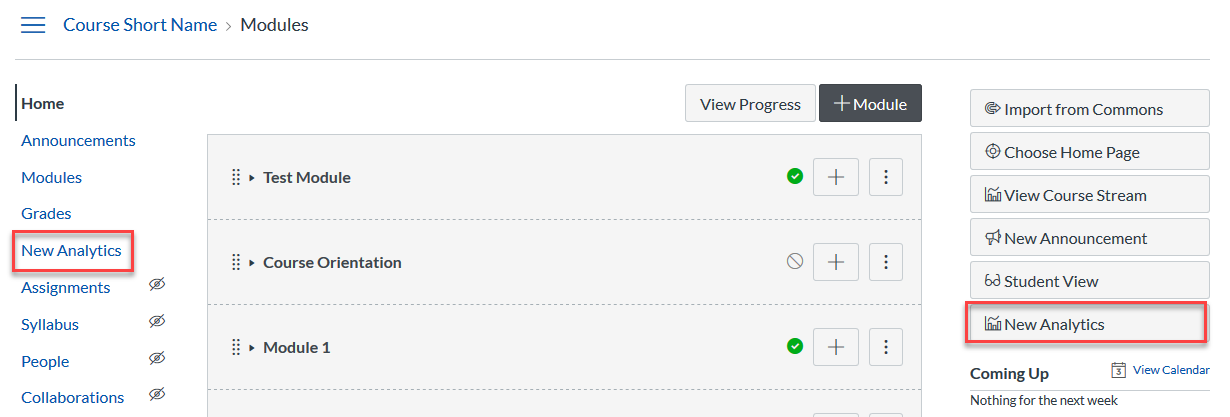
Access the new analytics tool using the New Analytics button in your course.
- View average course grade analytics as an interactive chart graph or a data table
- Compare the course average with an individual assignment, course section, or student filter using the chart graph comparison or data table comparison
- View average weekly online participation analytics as an interactive chart graph or a data table
- Compare the course average weekly online participation analytics with an individual student or section using the chart graph comparison or data table comparison
- Send a message to all students based on specific course grade or participation criteria
- Send a message to an individual student based on specific course grade or participation criteria
- View course grade and participation analytics for an individual student
Accessing New Analytics
Access the new analytics tool using the New Analytics button in your course.
Want to learn more?
Updated: June 27, 2025