*If viewing this page on a mobile device, click the dropdown menu titled “All Geology” for links to the other sustainable transportation webpages (Car-Share Services; Local Transit Systems; Turlock Transit; Using Alternative Transportation).

Quick Facts on the current state of air pollution in the Central Valley
- In 2022, the American Lung Association gave all counties in the San Joaquin Valley an F grade in “High Particle Pollution Days” and “High Ozone Days”[2]
- The Fresno-Madera-Hanford region was ranked 1st in cities most polluted by daily particulate matter
- The San Jose-San Francisco-Oakland region, which includes Stanislaus County, was ranked 5th in cities most polluted by daily particulate matter
- As a result of poor air quality in the Central Valley, life spans in the Central Valley are shorter and asthma rates are higher compared to other parts of California and the rest of the country[3]
- Vehicle emissions (nitrogen oxides and particulates) are a primary producer of air pollution in the Central Valley
We are all affected by adverse health and environmental effects caused by vehicle emissions. Therefore, each of us has a responsibility to curb vehicle emissions and this may be achieved through increased use of alternative modes of transportation. Alternative modes of transportation, or sustainable travel, include using public transit or car-sharing services, biking, carpooling/vanpooling, and walking. Participation in sustainable travel has environmental, health, and financial benefits. Visit Stanislaus State's Sustainability website for more information on Alternative Transportation Recommendations

Quick Facts on private car ownership
- More than 99% of new passenger cars sold worldwide still rely on fossil fuels[4]
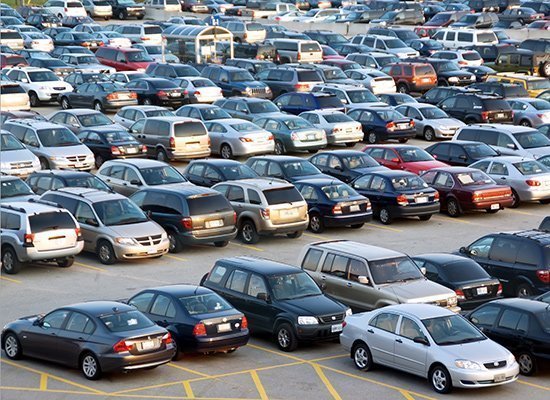
- On average, cars are parked 95% of the time[5]
- The average gas price in California is $5.369 (as of 8/14/22)[6]
- Researchers at MIT have identified that “Consumers systematically underestimate the true private cost of car ownership” and “if consumers did accurately account for the cost, they would own fewer cars.”[7]
[1] Yañez, P., Sinha, A., & Vásquez, M. (2020). Carbon footprint estimation in a university campus: Evaluation and insights. Sustainability. 12(1), 181. https://doi.org/10.3390/su12010181
[2] American Lung Association state of the air 2022. (2022). American Lung Association. https://www.lung.org/getmedia/74b3d3d3-88d1-4335-95d8-c4e47d0282c1/sota-2022.pdf
[3] Sankey, J. (2021). Faculty and student research: Air pollution, health, and a 51 million mile/year student commuter campus.
[4] Andor, M. A., Gerster, A., Gillingham, K. T. & Horvath, M. (2020). Running a car costs much more than people think—stalling the uptake of green travel. Nature 580, 453–455.
[5] Morris, D. (2016). Today’s cars are parked 95% of the time. Fortune. https://fortune.com/2016/03/13/cars-parked-95-percent-of-time/
[6] Gas prices. (n.d.). American Automobile Association. https://gasprices.aaa.com/?state=CA
[7] Moody, J., Farr, E., Papagelis, M. & Keith, D.R. (2021). The value of car ownership and use in the United States. Nature Sustainability 4, 769-774. https://doi.org/10.1038/s41893-021-00731-5
Sustainable Transportation webpages were created by Vivian Aguilar
Updated: August 09, 2023